2024
Heat Mapping of Various Health Cases in Biliran Province
Health case monitoring in Biliran Province has traditionally been a manual process — data gets collected and logged, but rarely analyzed spatially. Cases pile up in spreadsheets with no geographic context, making it hard for health officers to see disease clusters forming until it's too late. This project digitizes that workflow.
Overview
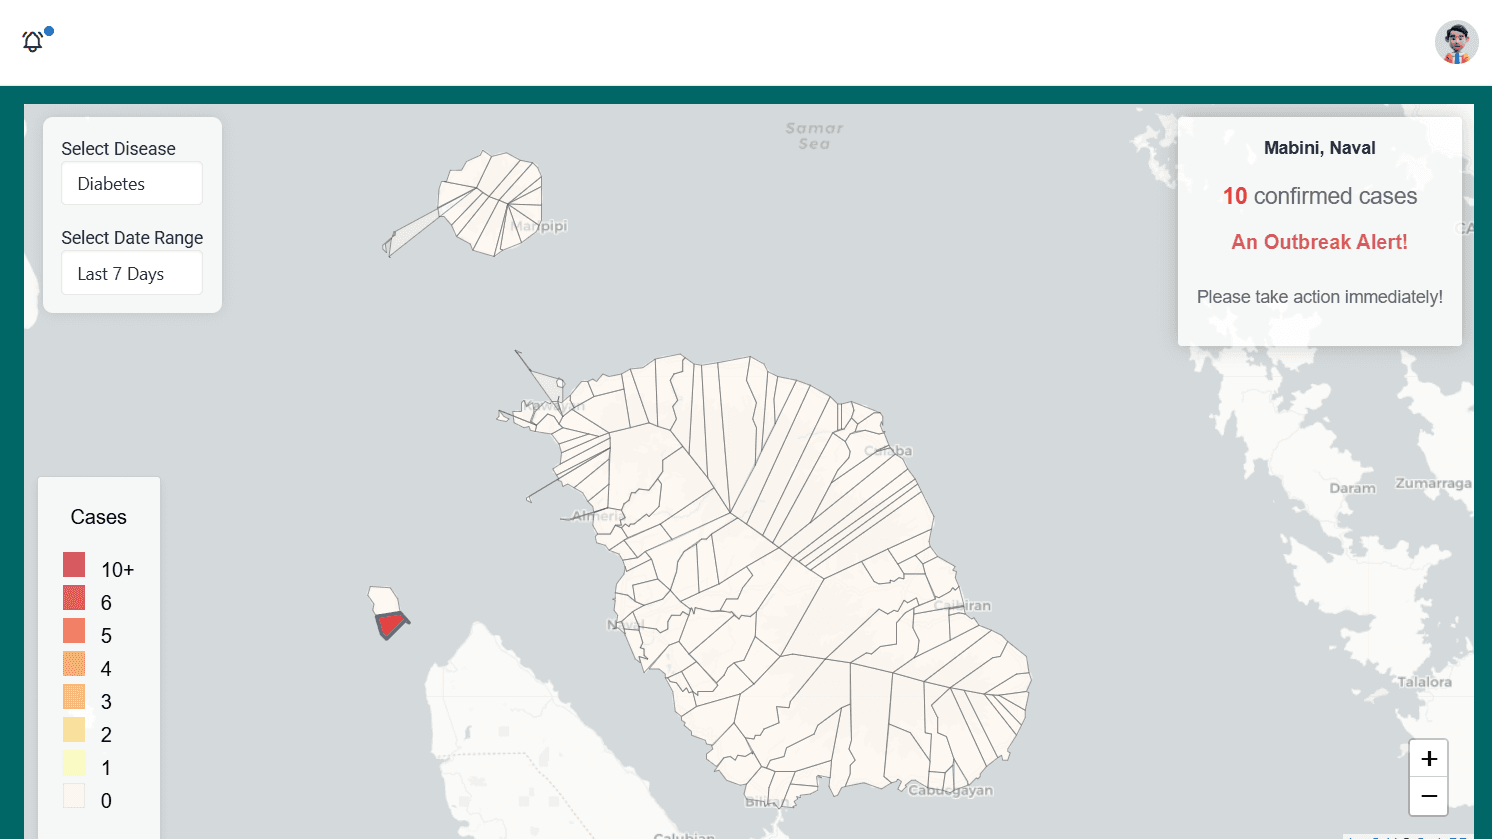
A web-based GIS built with Leaflet.js, PHP, and MySQL that visualizes disease incidence across Biliran Province. The system aggregates case reports at the barangay and municipal level, rendering them as interactive heatmaps and choropleth maps. A threshold-based alert engine flags high-incidence areas to help public health teams identify where attention is needed. The pilot covers 5 disease types to validate the approach before broader adoption.
Features
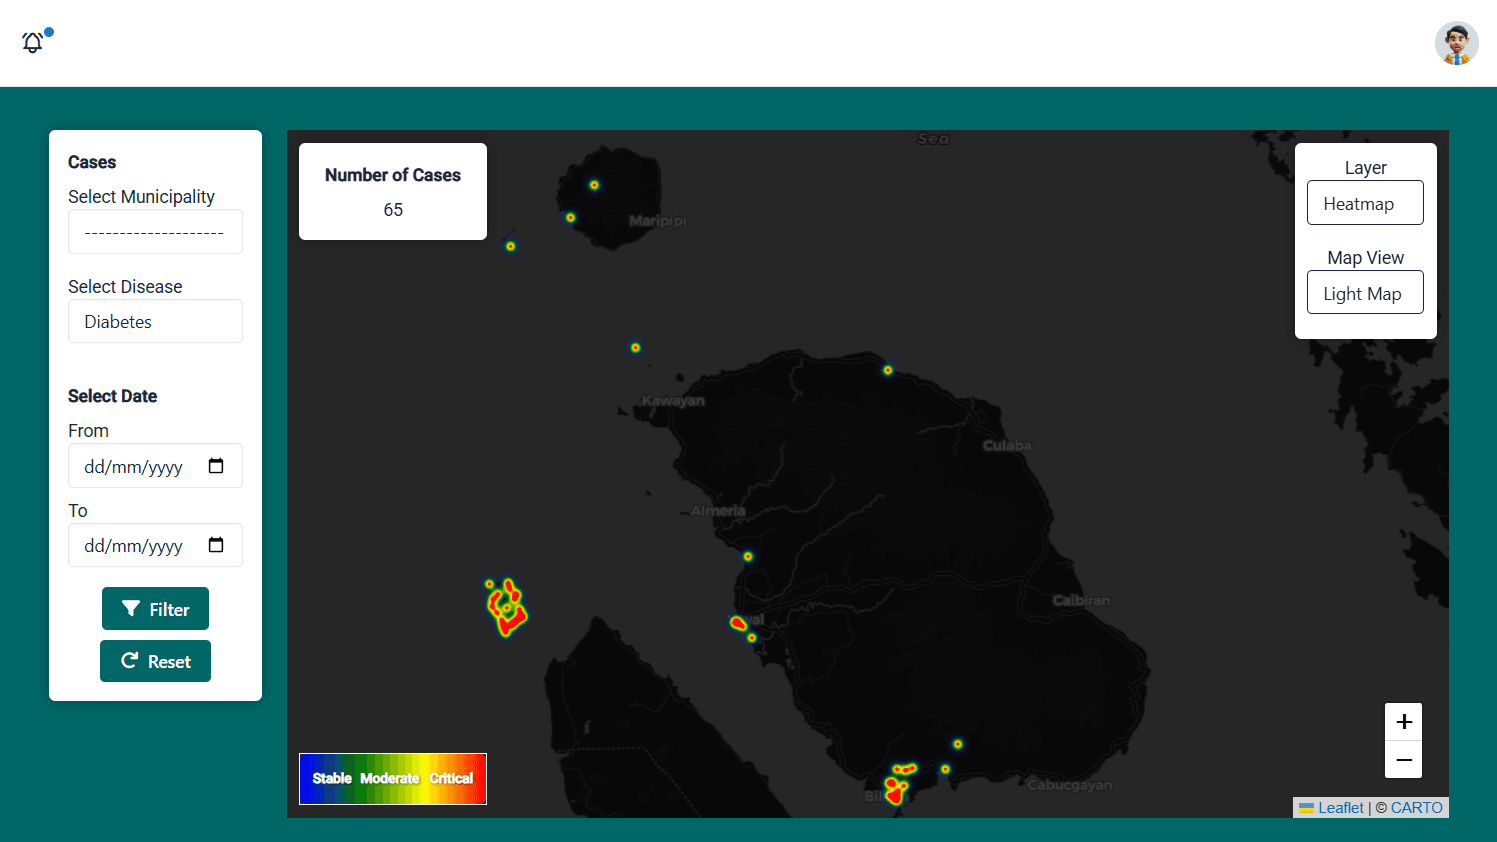
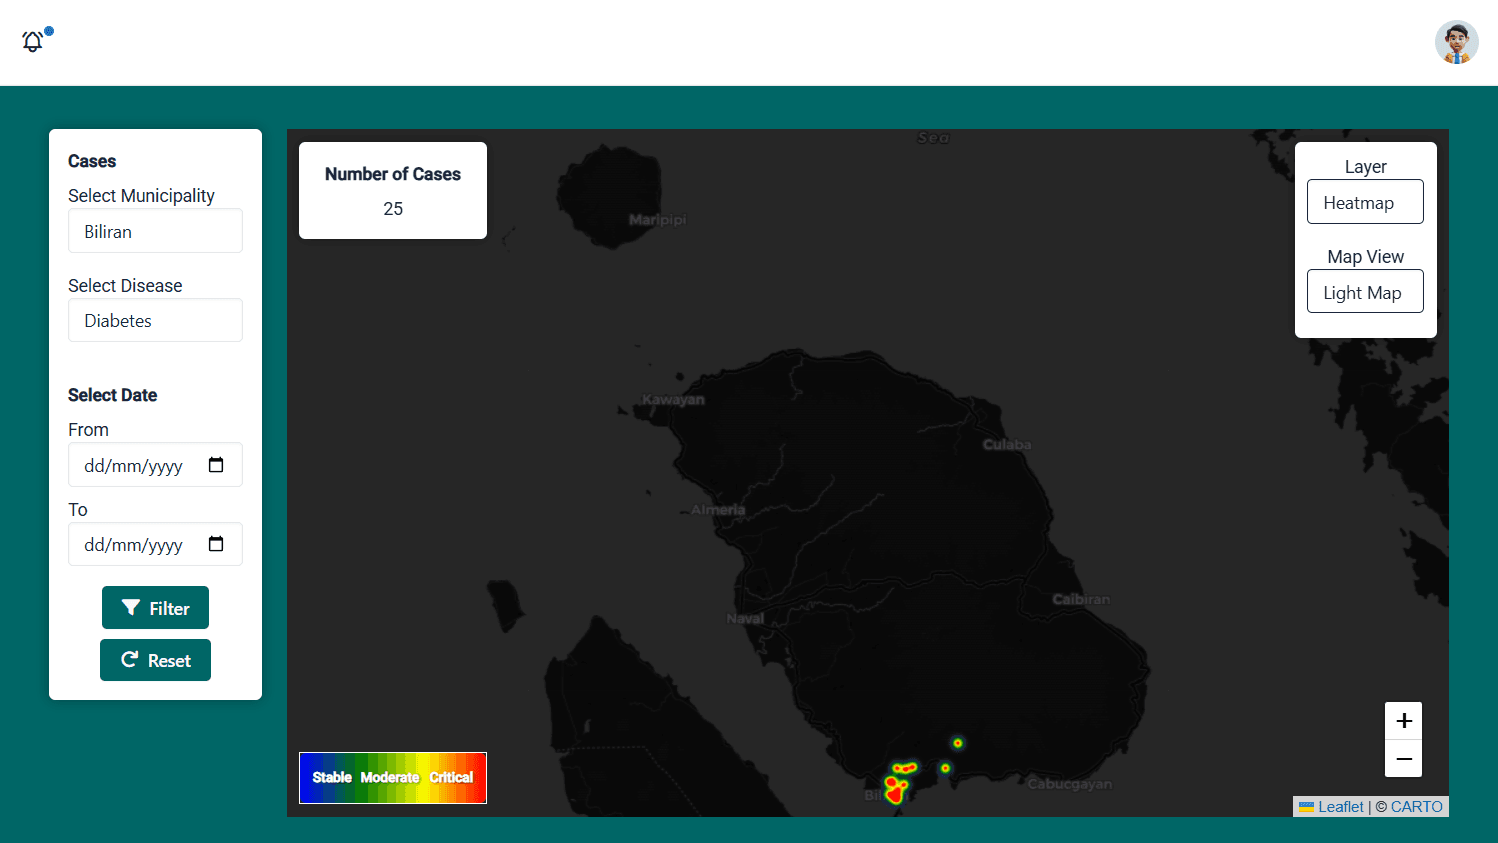
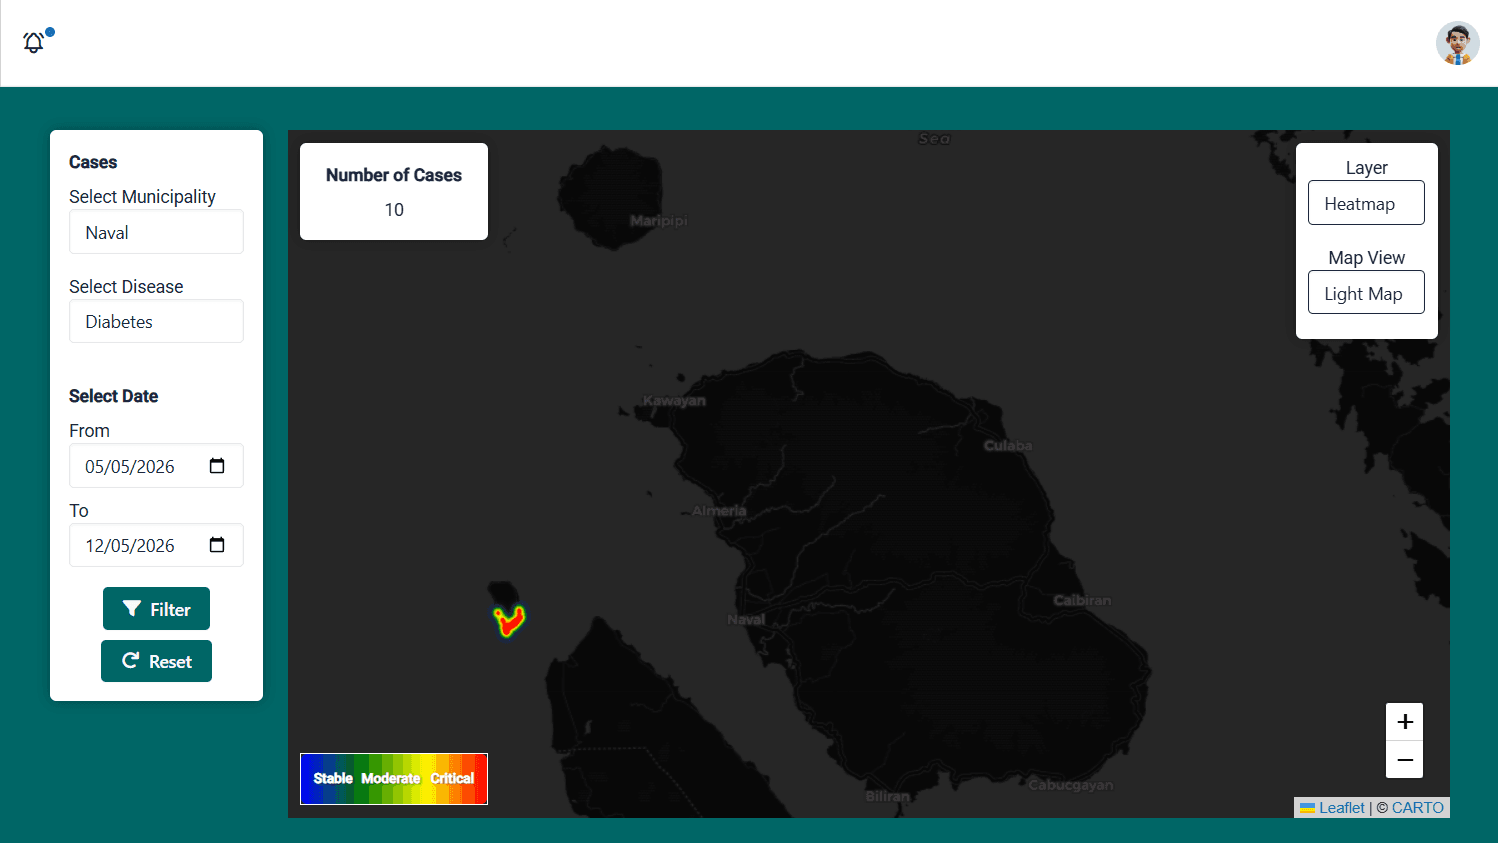
- Heat Map Layer — Weighted heatmap overlay that surfaces spatial clusters invisible in raw case logs.
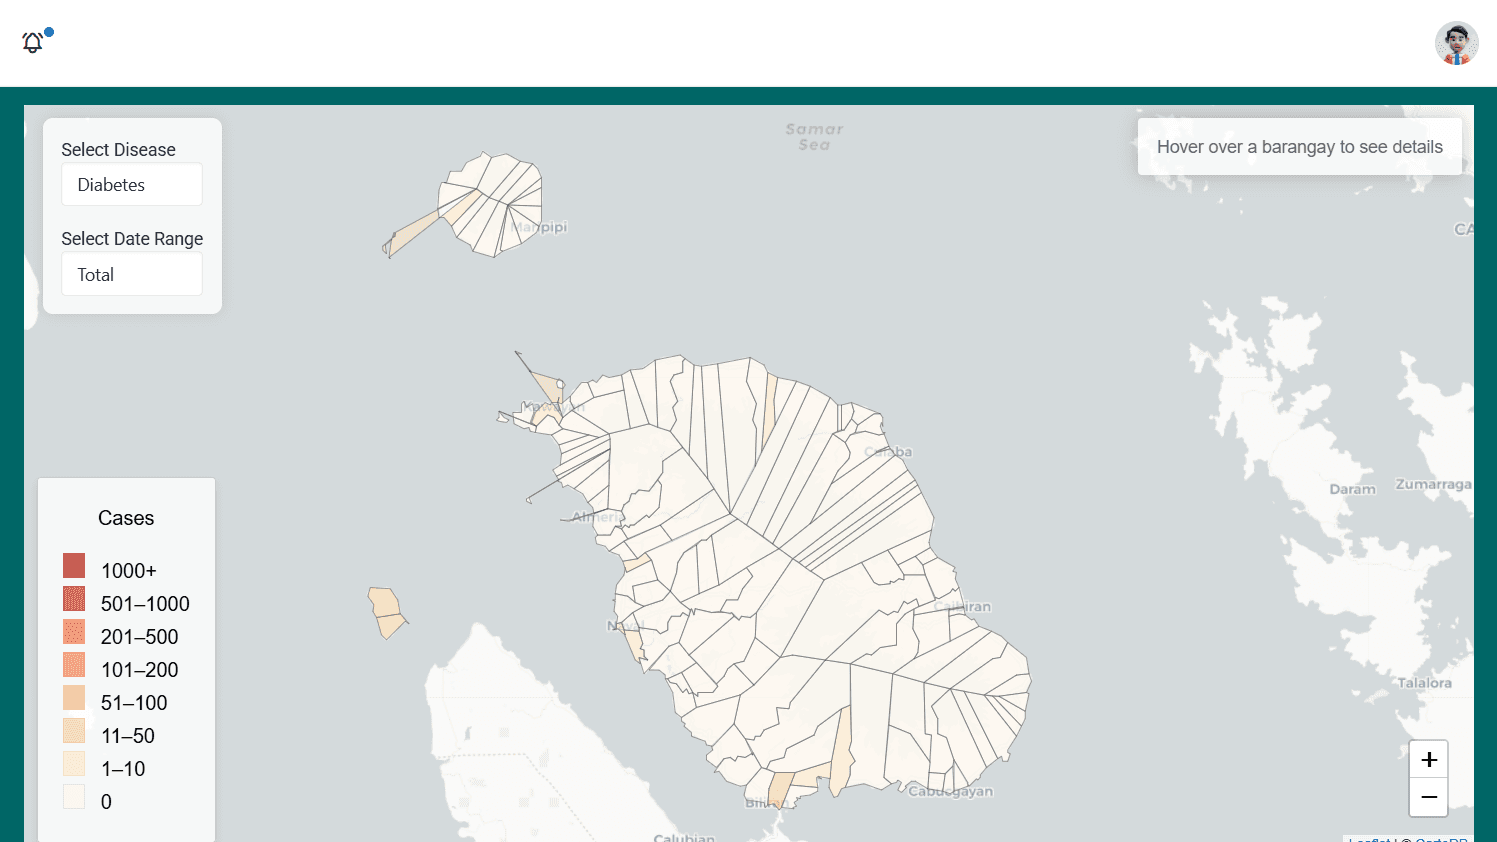
- Choropleth Map — Color-coded barangay-level visualization for comparing incidence across administrative units at a glance.
- Threshold-Based Alerts — Flags barangays and municipalities when weekly case counts exceed a defined threshold. Currently set at a flat 10 cases/week — a practical baseline, though ideally it should vary by disease type, population size, and historical rates.
- Multi-Case Tracking — Pilots 5 disease types with an architecture designed to accommodate more without structural changes.
Tech Stack
- Leaflet.js — Interactive map rendering with heatmap and choropleth layer plugins
- PHP — Backend API for data processing, threshold evaluation, and alert generation
- MySQL — Relational database for case records, geographic boundaries, and alert configurations
Challenges
Sparse geographic data — Barangay-level boundary data for Biliran wasn't available in standard GIS formats. Solved by digitizing administrative maps and cross-referencing with PSA boundary datasets.
Heatmap calibration — Getting the heatmap to render meaningfully across Biliran's mix of dense and sparse populations was harder than expected. Point radius, blur intensity, and weight scaling interact in non-obvious ways. The current calibration is still a work in progress, especially at varying zoom levels.
Threshold design — A hardcoded flat rate of 10 cases/week across all disease types works as a starting point but isn't epidemiologically sound. A realistic model needs to account for each disease's baseline rate, population density, and seasonal patterns. Building adaptive thresholds is the most impactful improvement planned for future development.
Reflection
The cases were already being logged — the gap was that those logs weren't being analyzed spatially. The GIS layer bridges that by turning records into a map that's actually interpretable.
Because the system wasn't deployed in a live environment, there are no concrete real-world outcomes to report. What it demonstrates is that digitizing this kind of manual workflow is feasible with accessible tooling, and that heatmaps, choropleths, and threshold alerts can meaningfully change how disease data is read — even with imperfect calibration. The foundation is there; the next step is field validation.